Technical Articles
04 Dec 2023
Unlock Solubility Enhancement Methods for Poorly Soluble Oral Drugs
04 Dec 2023
This article series is initiated and compiled by the Crystalline Cloud Solid-State Testing Center. Its aim is to create a platform for exchange and learning among industry peers. We intend to explore and share systematic applications of various solid-state characterizations, delve into the significance of test results and data, discuss and solve the various issues encountered in characterization testing. Our goal is to provide solutions and insights for challenges encountered during drug crystallization research and development.
Content Overview
1. Introduction
2. Applications of Laser Particle Size Analyzer
2.1 Laser Diffraction Method
2.2 Wet/Dry Methods
3. Development of Particle Size Distribution Methods
3.1 Development of Wet Methods
3.2 Development of Dry Methods
3.3 Method Validation
4. Testing Considerations
5. Conclusion
Introduction
In the process of pharmaceutical development, the particle size distribution of raw materials can significantly impact the performance of the final product, including aspects like solubility, bioavailability, uniformity of content, stability, and more. Ultimately, this can affect the safety, efficacy, and quality of the medication. Particle size distribution (PSD) has become an essential testing parameter in the quality control of active pharmaceutical ingredients (APIs) and pharmaceutical formulations.
Particle size distribution reflects the percentages of particles in different size ranges and is measured using various methods, including microscopy, sieving, sedimentation, centrifugation, dynamic light scattering, and laser diffraction. Laser diffraction, due to its speed, convenience, and minimal sample requirement, has become a commonly used method for particle size analysis.
Applications of Laser Diffraction Particle Size Analysis
Laser Diffraction Method
The principle of laser diffraction particle size analysis
Laser diffraction particle size analyzers determine the particle size distribution of a sample by measuring the scattering of a monochromatic laser beam when it interacts with the particles. The energy distribution of the scattered light is related to the particle sizes. By measuring the energy distribution (scattering angles) of the scattered light and applying Mie scattering theory and the Fraunhofer approximation, particle size distributions can be calculated. The measurement range can span from 0.02 to 3500 μm.

Particle Size Distribution
Equivalent spherical diameter is a measure of the size of a particle by measuring some characteristic of the particles and representing their size in terms of the diameter of a sphere that has the same characteristic. It's important to note that different particle size measurement methods can yield different equivalent spherical diameters, such as volume-equivalent spherical diameter, weight-equivalent spherical diameter, surface area-equivalent spherical diameter, and so on.

In a particle size distribution chart, the ideal state is represented by a normal distribution curve. The X-axis (horizontal axis) represents various particle sizes, and the Y-axis corresponds to the percentage of content. The closer the particle size distribution chart is to a normal distribution, the more uniform the particle distribution, indicating better usability.
The most commonly used characteristic values for particle size distribution are cumulative distribution values, Dv10, Dv50, Dv90, with Dv50 being the median. Additionally, depending on the characteristics of the sample particles, surface area mean D[3,2] and volume mean D[4,3] can also be used as characteristic values for particle size distribution.
Characteristics of Wet and Dry Methods
Depending on the dispersion medium used, particle size distribution testing can be divided into wet methods (where the dispersion medium is a liquid) and dry methods (where the dispersion medium is a gas). The choice between wet and dry methods should be based on the physicochemical properties of the sample.
Wet Method & Dry Method
Wet Method: This involves dispersing the sample in a suitable medium and is suitable for determining samples that are suspended or insoluble in the dispersing medium.
Dry Method: This method disperses the sample using compressed air, and the dispersion efficiency is directly related to the pressure settings. Dry methods are suitable for determining water-soluble samples or samples without a suitable dispersing medium.
Developing Particle Size Distribution Method
The development of wet methods for particle size distribution testing involves addressing the following issues:

Representative Sampling
Representative sampling is crucial to ensure test reproducibility, as the sampled portion must accurately represent the entire sample, especially for samples with larger particles (>70μm). If the sampling is not representative, measurement deviations of up to 20% can occur.
Choice of Dispersing Medium
The selection of an appropriate dispersing medium is critical in wet methods. When choosing a dispersing medium, multiple factors need to be considered:
It should be transparent and have a suitable viscosity for easy stirring and observation.
It should not undergo chemical reactions with the sample.
It should have low solubility or be insoluble, without swelling.
Its refractive index should be close to that of the sample.
It should wet the sample and prevent clumping.
It should not produce bubbles easily.
Based on different polarities, dispersing media can be categorized into five types: long-chain aliphatics like dodecane, mineral oil, sunflower oil, and palm oil; aliphatics like n-hexane, n-heptane, isooctane, and cyclohexane; alcohols like methanol, ethanol, and isopropanol; organic acids like acetic acid; and the most commonly used, water, which is transparent, cost-effective, environmentally friendly, and can mitigate the impact of temperature gradients caused by organic solvents.
Selection of Additives
To reduce surface tension, enhance wetting, and prevent re-agglomeration, a small amount of surfactant may be added when necessary. The choice of surfactant depends on the surface chemistry of the particles and the properties of the dispersing medium. Common non-ionic surfactants include Tween and Span; cationic surfactants include SDS; and anionic surfactants include CTAB.
To avoid re-agglomeration, precipitation, or coagulation of the dispersed sample, a dispersing agent may be added in small amounts to assist dispersion through mechanisms such as electrostatic stabilization, steric hindrance, and electrosteric stabilization. Examples include sodium hexametaphosphate, ammonium citrate, and sodium pyrophosphate.
Measurement Condition Setup
Measurement conditions in wet methods primarily involve the pump/stirrer speed, sample concentration, and ultrasonication.
Pump/Stirrer Speed
The pump/stirrer speed is determined by observing changes in particle size measurements as a function of the pump/stirrer speed. In general, an appropriate speed ensures that the sample enters the measurement cell uniformly and continuously, leading to reproducible results. At low speeds, larger particles in the sample may not suspend well, resulting in underestimated particle sizes. As the speed increases, proper suspension of particles is achieved, and the particle size stabilizes. At this point, the measured particle size closely matches the actual value. However, it is essential to note that high speeds may lead to the formation of bubbles, especially in emulsion samples.
Sample Concentration
Sample concentration is primarily determined based on optical density. If the sample concentration is too low, it may not be representative or may have poor signal-to-noise ratios. Conversely, a very high sample concentration can lead to multiple scattering phenomena, causing underestimated measurements. For small particle samples (particle size less than 10μm), the optical density should be less than 10%. For larger particle samples, the optical density should be in the range of 8% to 20%.
Ultrasonication
Ultrasonication can be used to disperse solid particles. The optimal ultrasonication parameters can be determined by monitoring changes in particle size with varying ultrasonication time or intensity. It is essential to note that if the optical density rapidly decreases after initial wetting, it may indicate that the sample component has dissolved in the dispersing medium, necessitating a change to a more suitable dispersing medium. If the particle size continues to decrease with prolonged ultrasonication, it suggests that particle breakage may be occurring. In the case of emulsion testing, ultrasonication is not required as it can promote further emulsification.
Development of Dry Methods
The development of dry methods for particle size distribution testing should consider sample properties, representative sampling, and measurement condition setup.

Sample Properties
Sample properties suitable for dry method testing include the following criteria: ease of dispersion through airflow, appropriate sample brittleness (not easily broken), and non-toxicity.
Representative Sampling
Similar to wet method testing, ensuring representative sampling is essential for test reproducibility.
Measurement Condition Setup
The measurement conditions in dry methods mainly include dispersing pressure, Venturi tube type, and sample injection rate.
Dispersing Pressure
The dispersing airflow pressure can be determined by observing changes in particle size measurements as a function of dispersing airflow pressure. Going from high to low pressure, the platform pressure for particle size separation is selected. The ease of particle dispersion depends on the particle size. As particle size decreases, the relative adhesive forces between particles increase. In general, smaller particle samples (particle size less than 10μm) tend to aggregate more and are more challenging to disperse, while larger particle samples (particle size greater than 10μm) aggregate less and are easier to disperse.
Venturi Tube Type
The choice of Venturi tube type depends on sample characteristics. Standard Venturi tubes are chosen for fragile samples, while small particles, especially those that are prone to sticking and agglomerating (easily fractured samples), should use high-energy Venturi tubes to increase collision opportunities and improve dispersion.
Sample Injection Rate
The sample injection rate is adjusted through parameters like injection vibration speed, the type of injection plate, and optical density setting (filtration of optical density). Optimizing the injection rate ensures continuous and stable sample flow while maintaining optical density within an appropriate range. If the optical density is too low, the signal-to-noise ratio may be insufficient. Conversely, excessively high optical density can weaken dispersion effects and potentially introduce false peaks. For small particle samples, the optical density typically ranges from 0.5% to 3%, while for other samples, it falls within the range of 0.5% to 6%.
Analytical Method Validation
Relative to the validation of other analytical methods, the validation requirements for laser diffraction particle size distribution testing are relatively straightforward. They primarily include ruggedness and precision (repeatability and intermediate precision), with some variations in the ruggedness requirements between dry and wet methods. Various pharmacopeias, such as USP <429>, EP 2.9.13, Chinese Pharmacopoeia 2020, and ISO 13320:2020, specify precision validation requirements, with the relative standard deviation (RSD) needing to meet specified criteria.
Testing Considerations
Based on Crystal Cloud's 12 years of experience in pharmaceutical solid-state research, the following summary and sharing of testing considerations for Particle Size Distribution (PSD) testing are provided:
Sample Solid-State Properties
The results of particle size testing are influenced by various factors, including the properties of the sample itself. In addition to the instrument and method used, the solid-state properties of the sample will also affect the testing results.
In practice, the particle sizes in the tested sample are rarely entirely consistent. Therefore, whether large and small particles in the sample can be mixed uniformly will directly determine the representativeness of sampling and adding samples by the experimenter. If the mixing is not uniform, large particles tend to settle at the bottom of the container. If only the upper layer of particles is taken for testing, there will be significant differences between the test results and the actual situation. The wider the particle size distribution in the sample, the more challenging it is to ensure representativeness in sampling.
In another scenario, if a significant portion of large particles in the sample results from aggregation and there is no effective reduction in aggregation, each test may collect intermediates of poorly dispersed particles. This will affect the repeatability of the test results.
Observation During Testing
During the testing process, observation is essential to assess the sampling status and determine if the sample is representative. Before testing, observe whether there are significant phenomena such as aggregation, clumping, or uneven particle size distribution in the sample. During the pre-dispersion of the sample in the dispersing medium, further observation should be made to check if large particles settle at the bottom. During the sample addition process, the sample container should be rinsed multiple times to ensure that large particles are introduced into the sampler.
In addition to sampling, the choice of an appropriate dispersing medium and its ability to effectively disperse the sample are also critical factors affecting test results. When pre-dispersing the sample, observe the dispersion efficiency of the dispersing medium.

Comparison of Different Particle Size Testing Methods
Left: The sample is prone to foaming, which can lead to the inclusion of bubbles as sample particles during testing, affecting the results.
Middle: The particles tend to settle, indicating poor dispersion.
Right: Good dispersion of particles with no significant settling, bubbling, or non-wettability issues.
Pharmacopeial particle size testing methods include microscopy, sieving, and laser diffraction. However, the particle size results obtained from different methods are usually not directly comparable. Laser diffraction instruments approximate the sample particles as spheres of equal volume and then calculate the diameter of these spheres to obtain particle size distribution results. Real-world samples are almost never perfectly spherical, so the instrument uses mathematical models to perform the fitting and calculations. Microscopy involves visually counting the proportion of particles within a certain field of view. Sieving separates particles based on sieve mesh size and calculates the weight percentage of particles within the target size range.

Indeed, the different methods for particle size analysis have distinct principles and calculation formulas, leading to variations in particle size data between these methods. Therefore, when comparing particle size results for a sample, it is essential to ensure consistency in the methods used.
Choice Between Wet and Dry Particle Size Testing
When conducting initial particle size distribution (PSD) testing for a sample, especially if it is expected to be insoluble in the dispersing medium, it is recommended to start with wet particle size testing. Sample aggregation is a common issue, and wet testing can be used to aid dispersion with the help of a dispersing medium. Additionally, ultrasonication can be employed to further improve dispersion. This approach generally achieves better dispersion, avoiding the negative impact of aggregation, and is suitable for rapidly testing a sample for the first time.
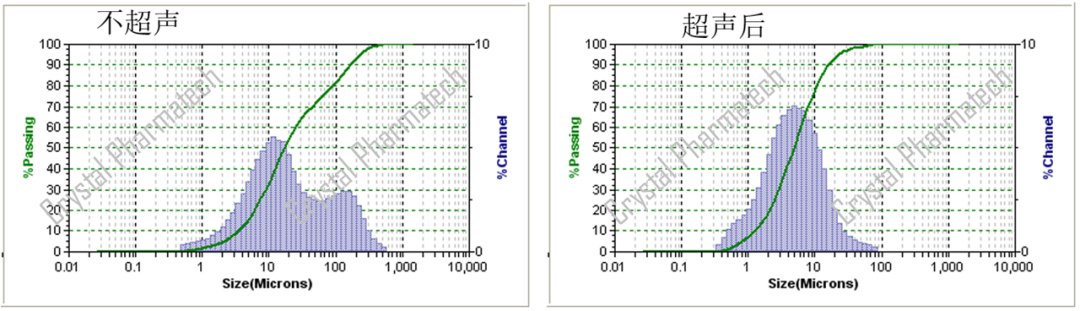
It's important to note that if the dispersing medium cannot effectively disperse the particles, ultrasonication may lead to particle aggregation. In such cases, the data obtained before ultrasonication may not accurately represent the true particle size of the sample. In such situations, it may be necessary to develop an appropriate particle size distribution (PSD) method specifically tailored to analyze that particular sample.
The synergy between PLM and PSD
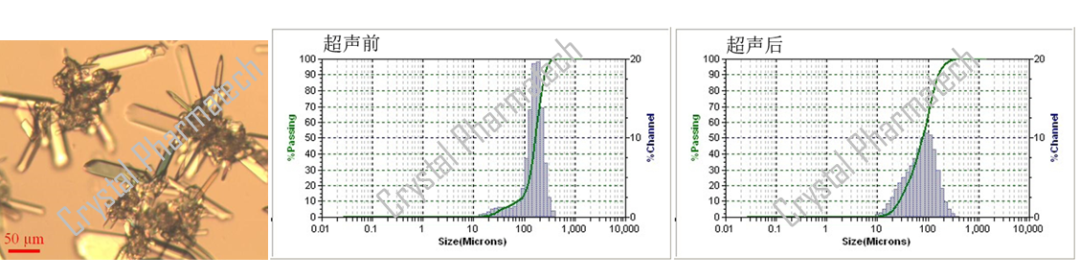
PSD, as a particle size characterization technique, can be used in conjunction with various other techniques to collectively characterize the properties of sample particles. For example, it can be combined with Polarized Light Microscopy (PLM). PLM provides a visual display of the approximate morphology, particle size, and the presence of particle aggregation, which can assist in PSD characterization.
As shown in the figure below, PLM reveals the evident presence of particle aggregation in the sample. When combined with PSD results, it becomes apparent that the particle size of the sample decreases after ultrasonication. This reduction in particle size is attributed to the disruptive effect of ultrasonication on particle aggregation. Consequently, the particle size measurements obtained after ultrasonication more closely represent the true state of the sample.
Conclusion
The study of pharmaceutical polymorphism is essential throughout various stages of drug substance and formulation research. Particle size analysis is an indispensable characterization technique in polymorphism research. At the Crystalline Cloud Solid-State Testing Center, we have multiple Particle Size Distribution (PSD) instruments, including the Mastersizer 3000 and Microtrac S3500, to provide our partners with fast and accurate PSD characterization. We are also equipped to assist in method development and validation work, contributing to the research and development of crystalline pharmaceuticals.


